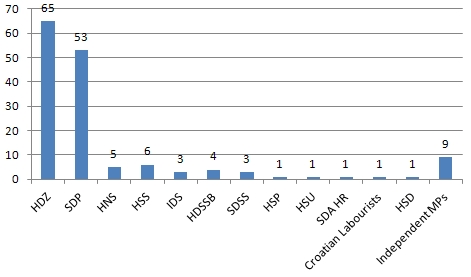
Following columns show statistics about current structure of MPs by:
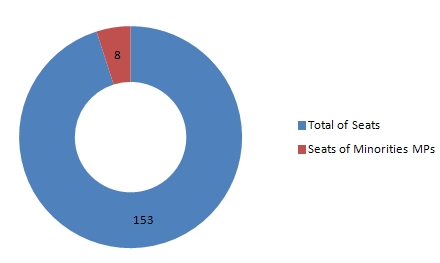
Party Name | Party MPs | Distribution | TOTAL | % | ||
Ethnics Minorities | Independent Non-party MPs | Diaspora | ||||
HDZ | 65 | 0 | 0 | 5 | 65 | 42,57 |
SDP | 53 | 0 | 0 | 0 | 53 | 34,74 |
HNS | 5 | 0 | 0 | 0 | 5 | 3,28 |
HSS | 6 | 0 | 0 | 0 | 6 | 3,94 |
IDS | 3 | 0 | 0 | 0 | 3 | 1,98 |
HDSSB | 4 | 0 | 0 | 0 | 4 | 2,21 |
SDSS | 3 | 3 | 0 | 0 | 3 | 1,98 |
HSP | 1 | 0 | 0 | 0 | 1 | 0,67 |
HSU | 1 | 0 | 0 | 0 | 1 | 0,67 |
SDA HR | 1 | 1 | 0 | 0 | 1 | 0,67 |
Croatian Labourists | 1 | 0 | 0 | 0 | 1 | 0,67 |
HSD | 1 | 0 | 0 | 0 | 1 | 0,67 |
Independent MPs | 9 | 4 | 5 | 0 | 9 | 5,95 |
TOTAL | 153 | 8 | 5 | 5 | 153 | 100,0 |
Data source: Internet Editorial Staff of the Croatian Parliament, 15 November 2011 | ||||||
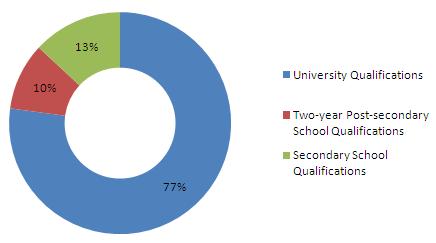
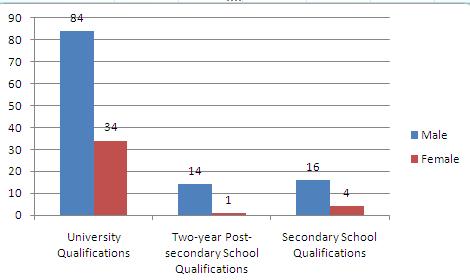
Educational background of MPs by gender
Educational Background | Total | Male | Female | % |
University Qualifications | 118 | 84 | 34 | 77 |
Two-year Post-secondary School Qualifications | 15 | 14 | 1 | 10 |
Secondary School Qualifications | 20 | 16 | 4 | 13 |
TOTAL | 153 | 114 | 39 | 100 |
Data source: Internet Editorial Staff of the Croatian Parliament, 15 November 2011 | ||||
Educational background of MPs by party affiliation
Party Name | Number of MPs | Distribution | ||
UQ | TPSQ | SSQ | ||
HDZ | 65 | 51 | 9 | 5 |
SDP | 54 | 45 | 2 | 7 |
HNS | 5 | 3 |
| 2 |
HSS | 6 | 3 | 1 | 2 |
IDS | 3 | 2 |
| 1 |
HDSSB | 4 | 2 | 1 | 1 |
SDSS | 3 | 3 |
|
|
HSP | 1 | 1 |
|
|
HSU | 1 |
| 1 |
|
SDA | 1 | 1 |
|
|
Croatian Labourists | 1 |
|
| 1 |
HSD | 1 | 1 |
|
|
Independent MPs | 8 | 6 | 1 | 1 |
TOTAL | 153 | 118 | 15 | 20 |
Data source: Internet Editorial Staff of the Croatian Parliament, 15 November 2011 | ||||
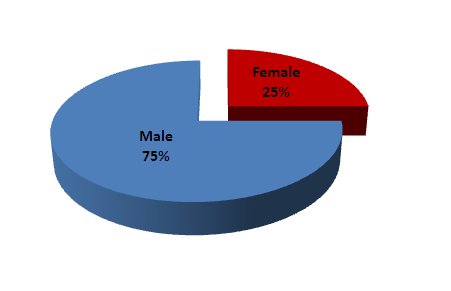
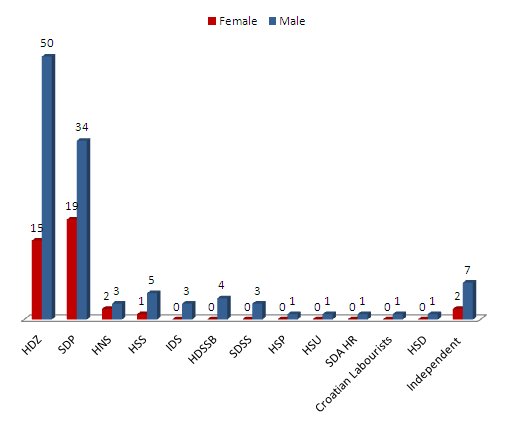
Members of Parliament by gender
Party Name | Number of MPs | Distribution | % Female | % Male | |
Female | Male | ||||
HDZ | 65 | 15 | 50 | 23,07 | 76,93 |
SDP | 53 | 19 | 34 | 35,85 | 64,15 |
HNS | 5 | 2 | 3 | 40,00 | 60,00 |
HSS | 6 | 1 | 5 | 16,67 | 83,33 |
IDS | 3 | 0 | 3 | 0,00 | 100,00 |
HDSSB | 4 | 0 | 4 | 0,00 | 100,00 |
SDSS | 3 | 0 | 3 | 0,00 | 100,00 |
HSP | 1 | 0 | 1 | 0,00 | 100,00 |
HSU | 1 | 0 | 1 | 0,00 | 100,00 |
SDA HR | 1 | 0 | 1 | 0,00 | 100,00 |
Croatian Labourists | 1 | 0 | 1 | 0,00 | 100,00 |
HSD | 1 | 0 | 1 | 0,00 | 100,00 |
Independent | 9 | 2 | 7 | 22,23 | 77,77 |
TOTAL | 153 | 39 | 114 | 25,49 | 74,51 |
Data source: Internet Editorial Staff of the Croatian Parliament, 15 November 2011 | |||||
Comparative data set:
MPs by Gender | By Election Results 2007 | At the end of 6th parliamentary term 2011 | ||
No | % | No | % | |
Female | 32 | 20,92 | 39 | 25,49 |
Male | 121 | 79,08 | 114 | 74,51 |
TOTAL | 153 | 100,00 | 153 | 100,00 |
Data source: Internet Editorial Staff of the Croatian Parliament, 7 November 2011 | ||||
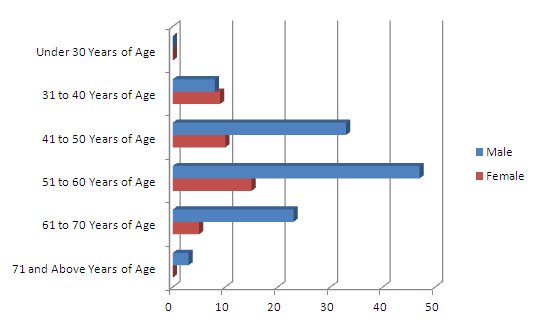
Members of Parliament by Age
Age Group | Total | Male | Female |
Under 30 Years of Age | 0 | 0 | 0 |
31 to 40 Years of Age | 17 | 8 | 9 |
41 to 50 Years of Age | 43 | 33 | 10 |
51 to 60 Years of Age | 62 | 47 | 15 |
61 to 70 Years of Age | 28 | 23 | 5 |
71 and Above Years of Age | 3 | 3 | 0 |
TOTAL | 153 | 114 | 39 |
Data source: Internet Editorial Staff of the Croatian Parliament, 7 November 2011 | |||
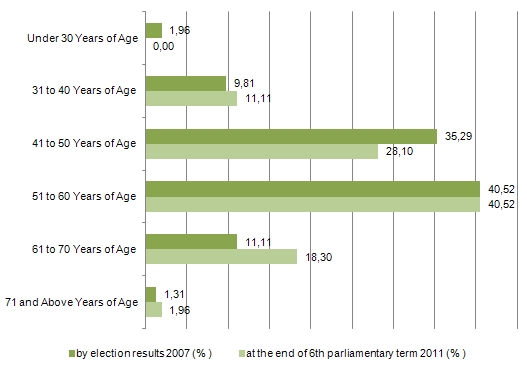
Comparative data sets:
Age Group | By Election Results 2007 (% ) | At the end of 6th Parliamentary Term 2011 (% ) |
Under 30 Years of Age | 1,96 | 0 |
31 to 40 Years of Age | 9,81 | 11,11 |
41 to 50 Years of Age | 35,29 | 28,1 |
51 to 60 Years of Age | 40,52 | 40,52 |
61 to 70 Years of Age | 11,11 | 18,3 |
71 and Above Years of Age | 1,31 | 1,96 |
TOTAL | 100 | 100 |
Data source: Internet Editorial Staff of the Croatian Parliament, 7 November 2011 | ||
Given information applies to 153 currently active terms of office and is updated immediately upon any change in structure of MPs.